How to build a stock screener with Danfo.js and Twilio Programmable Messaging
Time to read:
April 20, 2023
Written by
Reviewed by
In this tutorial, you will learn how to build a stock screener application capable of detecting stock breakouts in stocks listed on the S&P 500 index.
In stock trading, a breakout is when a stock's price breaks through a support or resistance level. A support level is a price level that a stock struggles to fall below, while a resistance level is a price level that a stock struggles to surpass.
To build this application, you will use the Polygon stock market API to obtain historical stock prices. You will use a library named Danfo.js to manipulate and analyze the historical stock price data. You will use the Puppeteer and Plotly.js modules to generate candlestick charts for the stocks. You will also use The Twilio Programmable Messaging API to send an SMS to your phone number when a breakout is detected.
The Twilio Programmable Messaging API is a service that allows developers to programmatically send and receive SMS, MMS, and Whatsapp messages from their applications.
Danfo.js is a JavaScript library for data manipulation and analysis that provides functionality similar to Pandas in Python.
Puppeteer is a Node.js library that allows for automated control of headless Chrome or Chromium browsers for web scraping, testing, and automation purposes.
Plotly.js is a JavaScript data visualization library that allows users to create interactive charts and graphs in web applications.
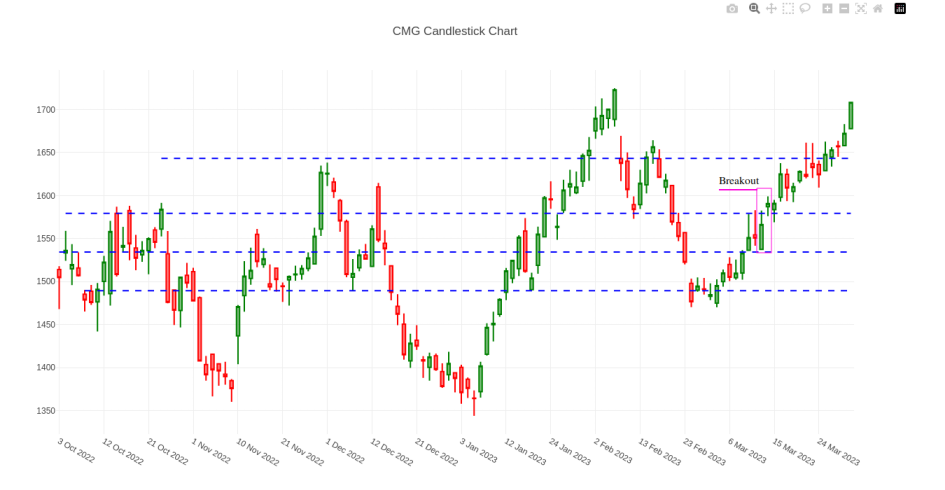
By the end of this tutorial, you will have an application capable of detecting breakouts similar to the one you see in the image below:
Tutorial Requirements:
To follow this tutorial, you will need the following components:
- Node.js (v14+) and npm installed.
- A free Twilio account.
- A free Polygon account.
Setting up the environment
In this section, you will create the project directory, initialize a Node.js application, install the required packages, and download a .json file containing a list of stocks in the S&P 500 index.
Open a terminal window and navigate to a suitable location for your project. Run the following commands to create the project directory and navigate into it:
Use the following command to create a directory named breakouts, where you will store the candlestick chart images for the stocks where breakouts were detected:
Run the following command to create a new Node.js project
Now, use the following command to install the packages needed to build this application:
With the command above you installed the following packages:
danfojs-node: is a JavaScript library for data analysis, manipulation, and visualization in Node.js.dotenv: is a Node.js package that allows you to load environment variables from a .env file intoprocess.env.puppeteer: is a Node.js library used to automate the interaction of headless Chromium instances with web pages, which allows for web scraping, generating screenshots and PDFs, and automating web testing.superagent: is a lightweight and flexible HTTP client library for Node.js that makes it easy to send HTTP requests and handle responses.twilio: is a package that allows you to interact with the Twilio API.
Download this JSON file containing a list of stocks on the S&P500 index and store it in your project's root directory under the name SP500.json.
Collect and store your credentials
In this section, you will buy a new Twilio Phone number, and collect and store your Twilio and Polygon credentials that will allow you to interact with the Twilio and Polygon APIs.
Twilio credentials
Open a new browser tab and log in to your Twilio console. Once you are on your console copy the Account SID and Auth Token, create a new file named .env in your project’s root directory, and store these credentials in it:
Navigate to the Buy a Number page in your Twilio console, and purchase a number with SMS capabilities. Copy your Twilio phone number and store it in the .env file as the value for TWILIO_NUMBER:
Now, store your personal phone number in the .env file as the value for YOUR_PERSONAL_NUMBER:
Be sure to add the + sign and use E.164 format when adding your phone number.
Polygon credential
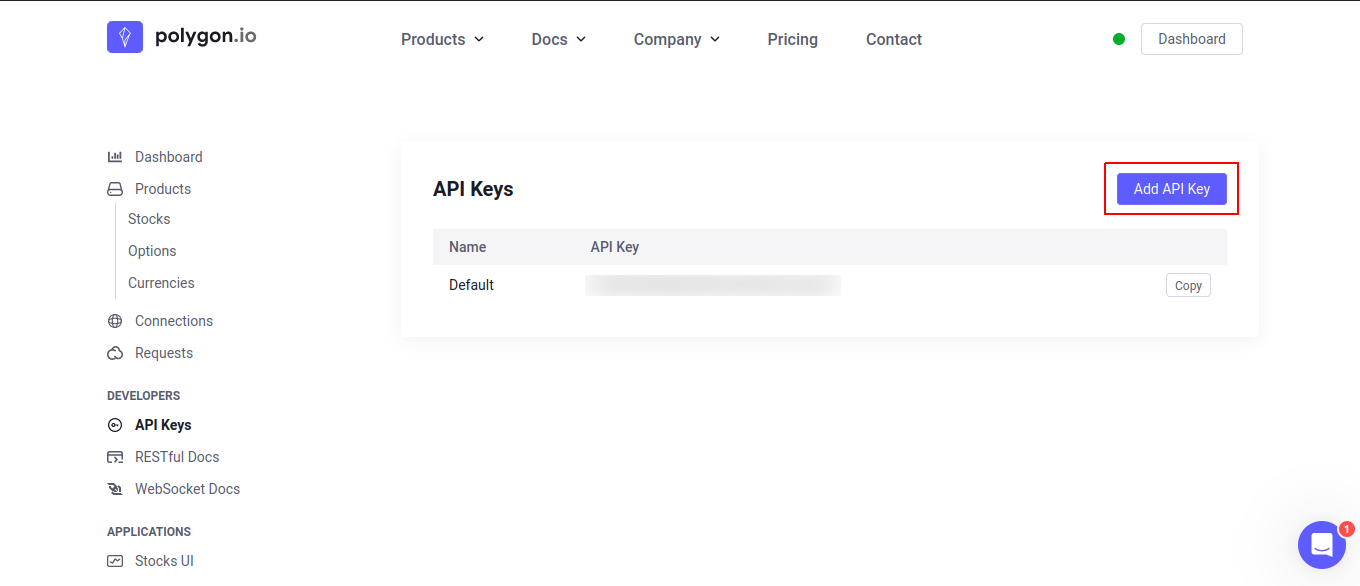
Open a new browser tab and log in to your Polygon account. Once you are logged in, hover on top of the Dashboard button found in the page’s top right corner, then click on the API Keys item on the dropdown menu that will appear to navigate to the API keys page.
On the API keys page, click on the Add API Key button to generate a new API Key.
Once the API key is generated, copy it and store it on the .env file as the value for POLYGON_API_KEY:
Retrieving Historical Stock Data
In this section, you will create a function that is responsible for sending GET requests to the Polygon API to retrieve historical stock price data. Then, you will create this application’s main function where you will convert the data into a data frame using the Danfo.js library.
Create a file named screener.js in your project’s root directory, open it using your preferred code editor, and add the following code to it:
First, the code requires the following packages: danfojs-node, superagent, fs, and dotenv.
Next, it retrieves and stores the TWILIO_ACCOUNT_SID and TWILIO_AUTH_TOKEN values from the environment variables using process.env in variables named accountSid and authToken.
Lastly, the twilio package is required and initialized with the retrieved accountSid and authToken values.
Create a function named getHistoricalData() below the require statements block:
The code defines an asynchronous function named getHistoricalData() that takes a stock ticker as a parameter. The function returns a Promise that will resolve to the historical data of the provided ticker.
The function sets the values of the today and sixMonthsAgo variables to the current date and the date 6 months before the current date, respectively. It then formats and assigns these values to the from and to variables as strings.
Finally, the function constructs a URL using the Polygon Aggregates endpoint, the provided ticker, the formatted from and to dates, and the Polygon API key and stores this URL in a variable named url.
Add the following code below the variable named url:
The code added uses the superagent module to make a GET request to the constructed Polygon API URL.
If there is an error, the promise is resolved with undefined. Otherwise, it resolves the promise with the daily historical stock prices of the past six months.
The daily historical stock prices are stored inside an array of objects in a field named results in the response body. Each object among other information contains the date as well as the stock’s open, close, high, and low prices.
Add the following code below the getHistoricalData() function:
The code defines an asynchronous function named main() that gets a list of stocks on the S&P 500 index stored in the SP500.json file and for each stock found gets the historical stock price data.
The code loops over each stock, calls the getHistoricalData() function with the stock ticker symbol as an argument, and stores the value returned by this function in a variable named OHLCData.
The function also waits for 15 seconds before moving on to the next stock to avoid exceeding the Polygon API rate limit for the free tier.
Finally, the code calls the main() function.
Add the following code below the variable named OHLCData:
The code added first checks if the value stored in the OHLCData variable is not equal to undefined. If that is the case, the code uses the value stored in the OHLCData and the Danfo.js library to create a new data frame that will allow you to easily analyze and process the historical stock price data.
Next, the code formats the values stored in the data frame's t column, which contains Unix timestamps representing the trading dates, into a more human-readable format and stores these values in a new column named d created by calling the df.addColumn() method.
The code uses the df.loc() method to access the d, o, h, l, and c columns and drop the remaining columns. The o, h, l, and c columns contain the stock’s open, high, low, and close prices respectively.
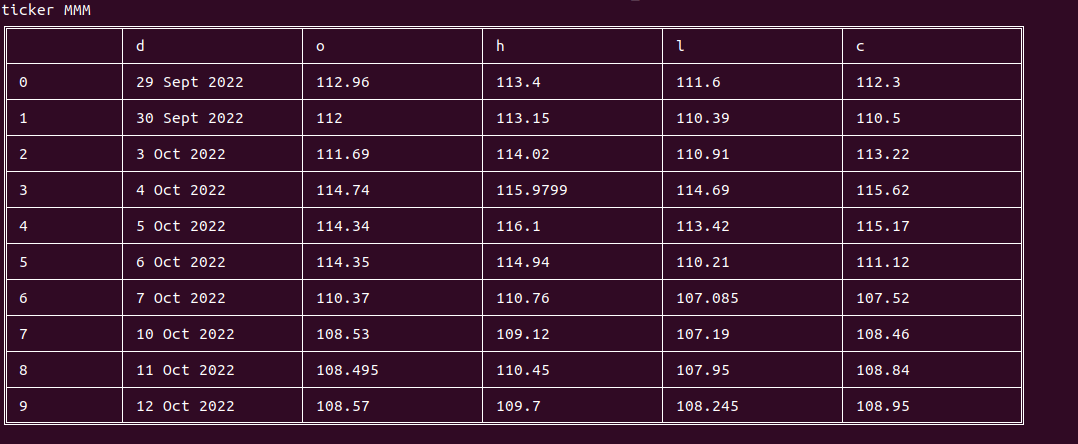
Finally, the code uses the df.print() method to print part of the data frame to the console.
Save your file and then go back to your terminal window and use the following command to run your application:
You should see the following output in your terminal:
Make sure you stop your application before moving to the next section.
Finding support and resistance levels
In this section, you will create the function responsible for finding support and resistance levels. There are several methods for finding support and resistance levels, but in this tutorial, you will use Fibonacci retracements levels to find them.
Fibonacci retracement levels are horizontal lines that indicate areas of potential support or resistance in a financial asset's price movements, based on key Fibonacci ratios.
You will calculate the levels based on the vertical distance between the high and low points of the stock data, and identify the stock prices that fall between the Fibonacci levels. These levels include 23.6%, 38.2%, 50%, 61.8%, and 78.6%.
If a stock's price breaks through a resistance level, it's a bullish breakout, which traders may see as a buying opportunity. Conversely, if a stock's price breaks through a support level, it's a bearish breakout, which traders may see as a selling opportunity. In this tutorial, you will only focus on detecting bullish breakouts
It's important to note that support levels can become resistance levels and vice versa when the price breaks through them.
Go back to your screener.js file and add the following code above the main() function:
Here, the code defines a function named findLevels() that takes a DataFrame df as a parameter and calculates the highest and lowest values in the h and l columns, respectively.
It then calculates the distance between them and computes Fibonacci levels based on the distance. The levels are stored in an array fibLevels, which consists of six elements: 0, 0.236, 0.382, 0.5, 0.618, and 1.
The Fibonacci levels are calculated as a percentage of the total distance, with each level multiplied by the distance and added to the lowest value.
Add the following code below the fibLevels:
The code added loops through the fibLevels array, comparing each level to the previous level to find the range between the levels.
Next, it loops through the c column (which stores closing prices) of the DataFrame to find the index of each closing price that falls within each level range. The function then stores each index and corresponding level in an array called levels.
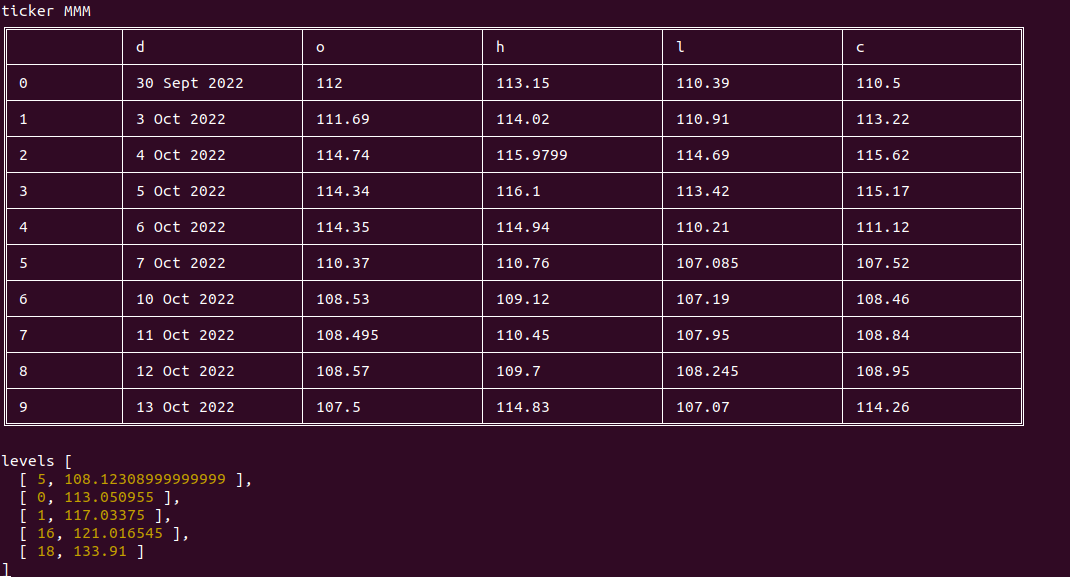
Finally, the function prints the levels on the console and then returns the levels array.
Go back to the main() function and the following code below the df.print(); line:
Here, you called the findLevels() function, passed the data frame as an argument, and stored the value returned in a variable named levels.
Save your file. Then go back to your terminal and use the following command to run your application:
You should see the following output on your terminal:
Make sure you stop your application before moving to the next section.
Plotting charts
In this section, you will use Puppeteer and Plotly.js libraries to plot candlestick charts for the stocks.
Go back to your code editor, create a file named chart.js inside the root directory of your project, and add the following code to it:
The code requires the puppeteer and the fs modules. The puppeteer module will be used to create headless browser instances where stock candlesticks charts will be plotted. The fs module will be used to save the plotted charts as PNG files.
Next, you will define a function that will be used to create the chart data and layout needed to plot a candlestick chart to visualize stock data.
Add the following code below the require statements:
The code defines a function named createChartData() that takes in three parameters: a data frame (df), a Fibonacci levels array, and a stock ticker.
The function creates a trace object. In data visualization, a trace object defines a set of data points to be plotted in a chart. It includes information on the chart type and data.
In the code above the trace object was used to define a candlestick chart that includes data taken from df on the opening, closing, high and low prices on different days. The object also specifies the candlesticks' colors.
Add the following code below the trace object:
The code added creates an array of shapes objects by mapping over the levels array. Each shapes object represents a horizontal line at the given level.
In data visualization, a shapes object is an optional property in a chart layout that adds shapes to a chart like lines, rectangles, or circles. Here it will be used to draw lines that represent support and resistance levels.
The x0 and y0 coordinates of each line correspond to the date and price of the level and specify where the line starts. while x1 and y1 determine the line's endpoint on the x and y-axis, respectively.
The line property is used to specify the line’s color, width, and dash attributes.
Add the following code below the shapes array:
Here, the code defines the chartLayout object that specifies the chart's properties such as title, width, height, axis properties, and support and resistance levels.
Next, the trace object is added to an array named chartData.
Lastly, the code returns an object containing the chartData array and chartLayout object.
Now, you will create a function that will be responsible for using Puppeteer and the Plotly.js library to plot a candlestick chart and save it in the /breakouts directory as a .png file.
Add the following code below the createChartData() function:
This code defines a function called plotChart that takes in three parameters: chartData, chartLayout, and ticker.
Inside this function, the Puppeteer library was used to launch a new browser instance and create a new page.
Then, the code sets the page's viewport to a width of 1366 pixels and a height of 768 pixels and then sets the HTML content of the page to include the Plotly.js library and a div with an id of chart.
Add the following code to the bottom of the plotChart function:
The code added uses the page.evaluate() method to pass the chartData and chartLayout objects to a function that creates a new Plotly.js chart and plots the data on the div element with the chart id.
Next, the code locates the div element with the chart id using the page.$() method, stores this element in a variable named chartDiv, and takes a screenshot of the chart using the chartDiv.screenshot() method.
It then uses the fs module to save the screenshot as a .png file in the /breakouts directory and uses the value of the ticker parameter as the filename.
Finally, the code closes the browser instance and prints a message to the console indicating that the chart image has been saved.
Add the following line of code below the plotChart() function to export the createChartData() and plotChart() functions:
Go back to your screener.js file and add the following code just below the other require statements at the top of the file to import the createChartData() and plotChart() functions:
Go to your main() function and add the highlighted code below the levels variable:
In the code added, the createChartData() function is called to create the data and layout objects for the candlestick chart, by passing the DataFrame (df), the support and resistance levels (levels), and the stock ticker symbol (ticker) as arguments.
Next, the plotChart() function is called to generate a PNG image of the candlestick chart, by passing the chart data and layout objects returned by the createChartData() function and the ticker as arguments.
Save your file, then go back to your terminal window and use the following command to run your application:
After running the command above you should see the MMM candlestick chart image that looks similar to the following on the /breakouts directory:
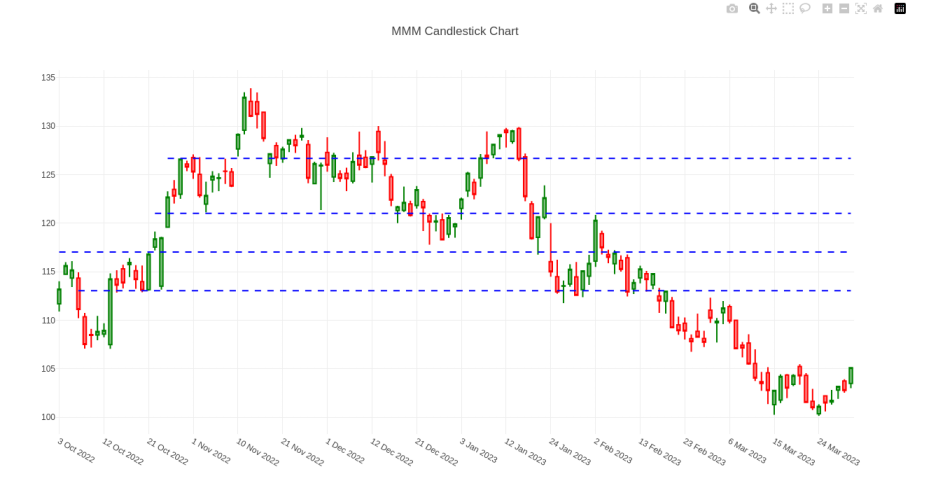
Note: It may take a few seconds for the image to appear in the /breakouts directory. You will see a message that says chart image saved in your terminal when the process is complete.
Make sure you stop your application and delete all images on the /breakouts directory before moving to the next section.
Detecting Breakouts
In this section, you will create a function that checks if the current stock price has broken out of the support and resistance levels.
Add the following code above the main() function:
This code defines a function named detectBreakout(), this function takes in an array of levels (levels), which represent potential support and resistance levels for a stock price, as well as the previous and last candlestick data (previousCandle, lastCandle).
The function loops through each level in the levels array and checks if the opening price of the previousCandle is below the level and if the opening price of the lastCandle is above the level.
If both conditions are true for a particular level, then the function returns true, indicating that a breakout has occurred.
If none of the levels trigger a breakout, the function returns false.
Now, go to your main() function and replace the lines of code where you called the createChartData() and the plotChart() functions with the highlighted code:
Here, first the df.iloc() method is used to get the second last and last candle from the data frame and store these rows in variables named previousCandle and lastCandle respectively.
The code then calls the detectBreakout() function and passes the levels array, the previousCandle, and the lastCandle rows as arguments to check if there has been a breakout or not.
If there has been a breakout, the createChartData() function is called to create the chart data and layout, which is then passed to the plotChart() function to create and save a chart image for the stock.
Sending notifications
In this section, you will create a function that uses The Twilio Programmable Messaging API to send an SMS to your phone number when a breakout has been detected.
Add the following code above the main() function:
This code defines a function named sendNotification() that takes in a stock object as its parameter.
This function uses the Twilio module to send an SMS message from your Twilio phone number to your personal phone number with the message "Breakout found: ${stock.name} - ${stock.symbol}", where stock.name and stock.symbol are placeholders for the actual name and symbol of the stock.
Go to the main() function and add the highlighted code below the plotChart() function call:
Here, the added code calls the sendNotification() function and passes the stock object as an argument, to send a notification to your phone number to inform you that a breakout has been detected.
Save your file and then go back to your terminal and use the following command to run your application
Once a breakout has been detected, a chart image will be generated and stored in the /breakouts directory, and you will receive an sms containing the stock name and symbol.
If you ran this application before the market opened on March 14, 2023, this application would have sent you a message stating that a breakout was found for the Chipotle Mexican Grill stock - CMG:

Conclusion
In this tutorial, you learned how to build a stock screener application that is capable of detecting bullish stock breakouts in the S&P 500 stocks. You learned how to use the Polygon API for retrieving historical stock price data, Danfo.js for data manipulation, Puppeteer and Plotly.js for chart creation, and Twilio Programmable Messaging API for sending SMS notifications when a breakout was found.
The code for the entire application is available in the following repository https://github.com/CSFM93/twilio-stock-screener.
Carlos Mucuho is a Mozambican geologist turned developer who enjoys using programming to bring ideas into reality. https://twitter.com/CarlosMucuho

Related Resources
Twilio Docs
From APIs to SDKs to sample apps
API reference documentation, SDKs, helper libraries, quickstarts, and tutorials for your language and platform.
Resource Center
The latest ebooks, industry reports, and webinars
Learn from customer engagement experts to improve your own communication.
Ahoy
Twilio's developer community hub
Best practices, code samples, and inspiration to build communications and digital engagement experiences.