Gather Browser Logs for Efficient Troubleshooting
Time to read:
January 10, 2024
Written by
Reviewed by
The Twilio Voice SDK is a powerful tool that empowers developers to integrate voice calling capabilities seamlessly into their applications. However, in the pursuit of perfection, even the most finely tuned applications can encounter disruptions. This is where the significance of comprehensive browser logs comes into play, proving to be a game-changer when troubleshooting issues related to the Voice JS SDK.
In this comprehensive guide, I will lead you through a step-by-step process to configure logs on the debugging level and effectively gather browser logs, with a specific emphasis on troubleshooting using the Twilio Voice JS SDK.
Prerequisites
In order to follow along, you’ll need:
- Google Chrome or Microsoft Edge browser
- Mac/Windows OS
- Voice JS SDK client with
logLevelset todebug, as described below
Check your logLevel
The console log level that the Voice JS SDK client uses is a setting that is configured using the loglevel based logger to allow for runtime logging configuration. Read more about best practices here.
To configure the loglevel, use the logLevel property in the DeviceOptions object when instantiating a Twilio.Device. Refer to the example below:
Utilize browser-based debugging
The Twilio Voice JS SDK is optimized for a seamless experience on supported desktop browsers such as Google Chrome and Microsoft Edge. Both step-by-step processes will be demonstrated in this article.
Whether you're using Chrome or Edge, the steps are the same, ensuring that you can leverage the power of browser logs regardless of your preferred browser.
Set up and start collecting browser logs
Step 1: Open the Chrome menu and navigate to Developer Tools. You can open Developer Tools with keyboard shortcuts or through the Chrome menu. The keyboard shortcuts are as follows:
- Mac OS: CMD+Shift+J or CMD+Shift+C
- Linux, Chromebook and Windows: Ctrl+Shift+J
- From the Chrome menu: Open the Chrome menu and go to More Tools > Developer Tools.
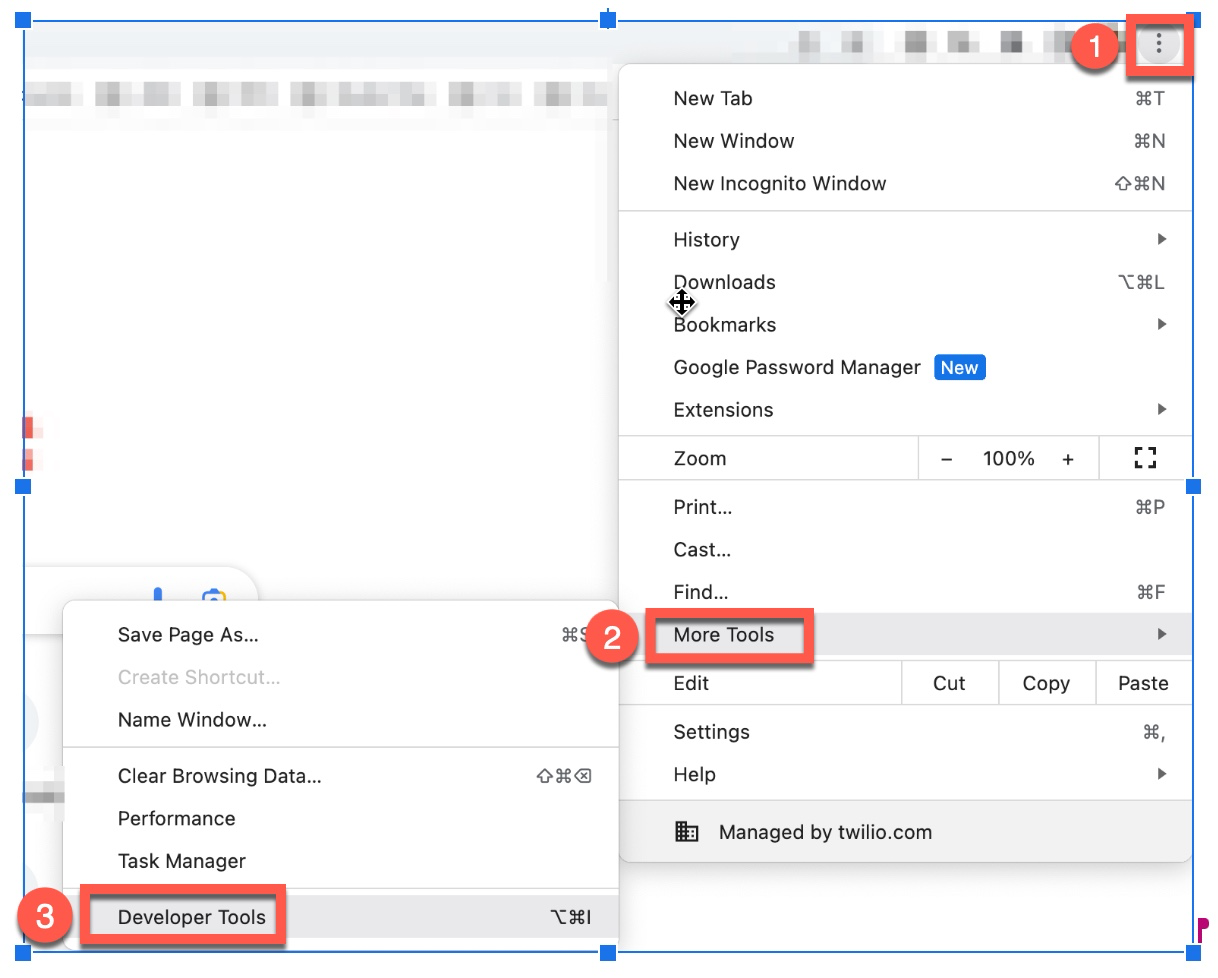
Step 2: Click on the settings icon in the upper right corner of the Developer Tools window.
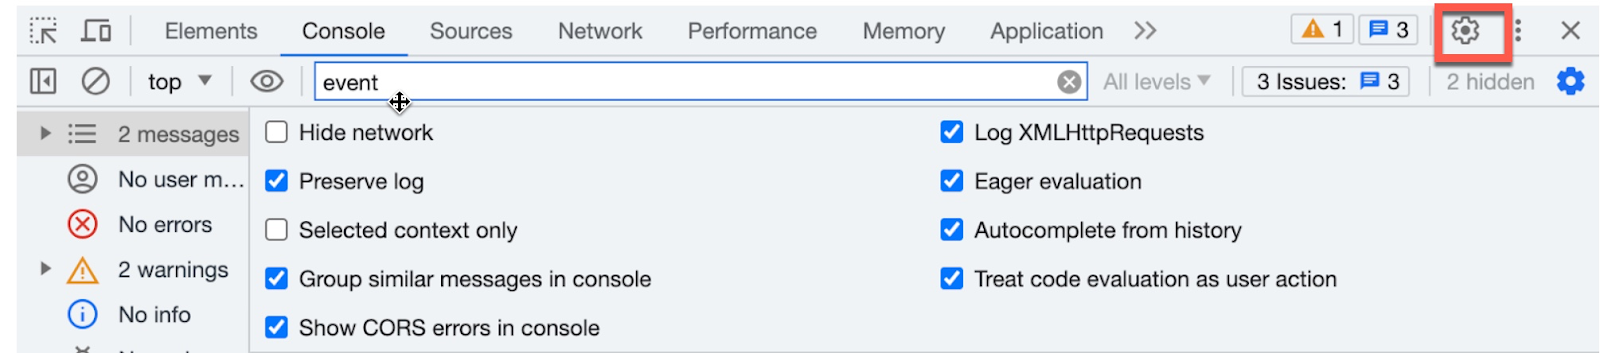
Step 3: Select the following checkboxes
- Under Console
- Log XMLHttpRequests
- Show timestamps
- Preserve log upon navigation
- Under Network
- Preserve log
- Record network log
Step 4: Close the window.
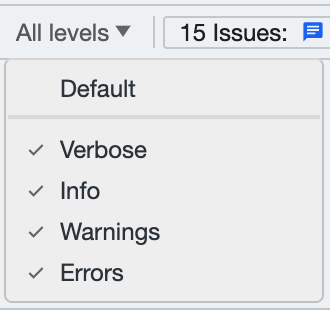
Step 5: To select a filter level on the Console tab, locate the Log level list at the top right corner of the window. Choose any filter level that is not currently selected. If you want to select all levels, the log level selection will display as All levels.
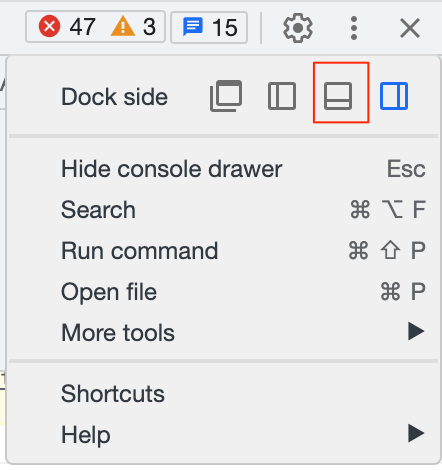
Step 6: To collect network logs during issue reproduction, select the menu and anchor the window at the bottom by selecting the icon with the smaller box on the bottom next to the Dock side option.
Step 7: Keep the console open and replicate the steps necessary to reproduce the issue being investigated.
Step 8: After reproducing the issue, navigate to the console tab and gather the log files. Simply right-click on the log lines and select "Save As" to save them.
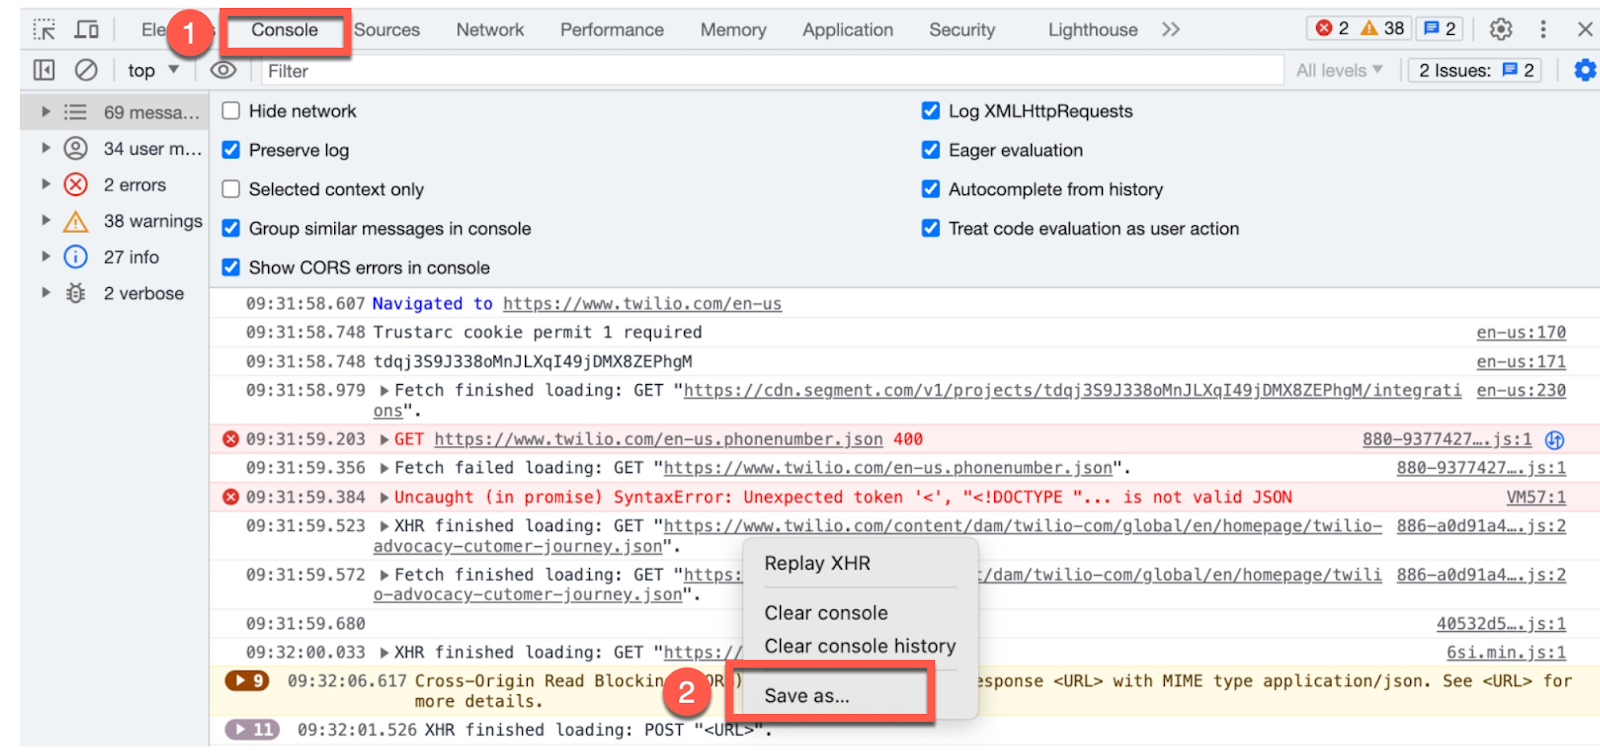
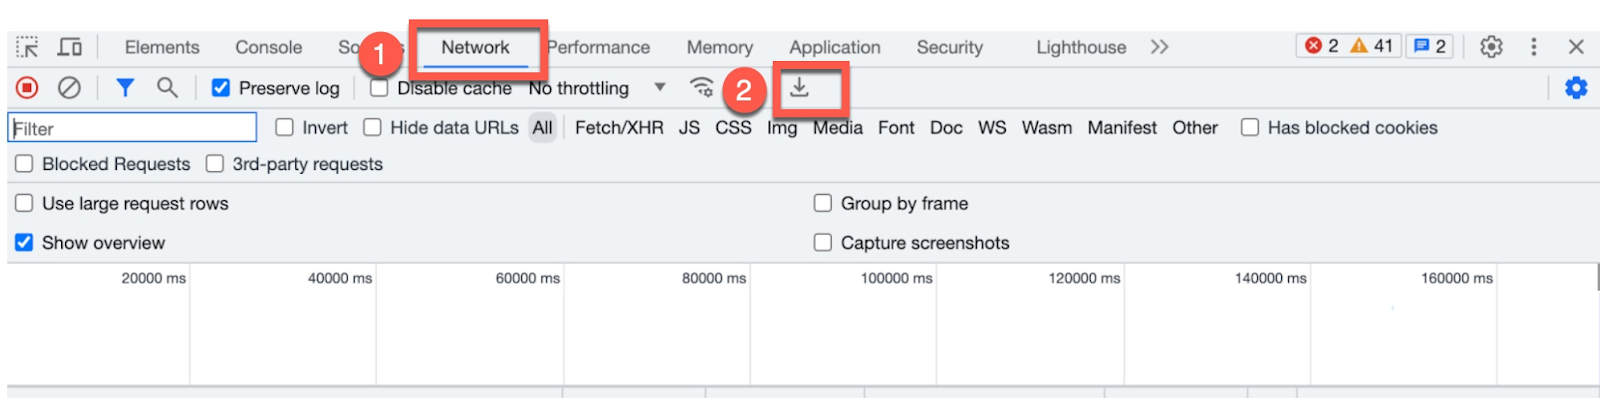
Step 9: Similarly, go to the Network tab and click on the export download icon to save the network logs
Step 10: You might be able to identify and fix the problem yourself from the logs. Alternatively, you can upload the log file to a support ticket along with the approximate timestamp when the issue occurred and the call SID as a reference to troubleshoot the issue.
Step 11(Optional): If you have not yet opened a support ticket for the issue, please follow the instructions provided in this link to create and submit a support ticket for assistance.
What's next for troubleshooting Voice JS SDK issues?
Understanding how to collect and analyze browser logs is a valuable skill for troubleshooting Voice JS SDK issues and will save time if you file a support ticket. By following the steps outlined in this article, you can effectively capture and examine browser logs, gaining deeper insights into potential errors, performance bottlenecks, and other issues affecting the user experience.
Furthermore, you have the opportunity to enhance your troubleshooting capabilities by referencing the Voice Javascript SDK best practices. Following these best practices will ensure your users have a seamless calling experience. It will also make it convenient to troubleshoot connection and call quality issues.
Khushbu Shaikh a dedicated Lead Technical Account Manager who is an invaluable asset to the personalized support team. With a wealth of experience, Khushbu excels in working with numerous accounts, diligently assisting them in overcoming challenges and providing effective solutions. Her expertise lies in troubleshooting customer issues, offering insightful workarounds, and delivering exceptional support. For any inquiries or assistance, Khushbu can be reached at kshaikh [at] twilio.com.
Related Resources
Twilio Docs
From APIs to SDKs to sample apps
API reference documentation, SDKs, helper libraries, quickstarts, and tutorials for your language and platform.
Resource Center
The latest ebooks, industry reports, and webinars
Learn from customer engagement experts to improve your own communication.
Ahoy
Twilio's developer community hub
Best practices, code samples, and inspiration to build communications and digital engagement experiences.