Monitoring Web Server Performance with Windows Presentation Foundation and ScottPlot
Time to read:
October 08, 2020
Written by
Reviewed by
This post is part of Twilio’s archive and may contain outdated information. We’re always building something new, so be sure to check out our latest posts for the most up-to-date insights.
.png")
Windows Presentation Foundation (WPF) framework provides a rich graphical user interface for desktop applications. Charts are a familiar component in many applications, providing users with a visual way to consume data, observe trends and patterns, and provide a more attractive and engaging application.
Many libraries provide various charting capabilities. In selecting a library to use, you should consider many factors. Foremost is compliance and compatibility with the framework used to implement the project.
If you’re building a new .NET project these days, it’s likely you’ll be using .NET Core, so the charting library you select has to be compatible. Since .NET Core is relatively new, compared to the .NET Framework, there are fewer libraries available.
Some charting packages are big, feature-rich, time-consuming to learn to use, and expensive. In many large applications, these tools provide continuity between components while also providing a high degree of styling, which is very desirable. The application you will build in this tutorial requires a chart to plot the connection speed to a website as presented in this project; getting it working with minimal overhead is the objective.
ScottPlot is easy to implement and use, and its compactness makes it a great choice for many real-time data acquisition projects. The size of the library (141.46 KB), installation, and functionality are all developer-friendly. It is MIT-licensed and only contains MIT-licensed components, so it can be used in commercial applications without requiring attribution, permission, or opening your source code.
This tutorial will guide you through building a WPF application that uses a bar chart to display continuously updated data. You’ll see how to design the user interface and how to link the UI to the stream of data from an external data source.
Prerequisites
You’ll need the following tools and resources to build and run this project:
Windows 10 – It puts Windows in the Windows Presentation Foundation.
.NET Core SDK 3.1 – The SDK includes the APIs, runtime, and CLI.
Visual Studio 2019 with the following workloads and individual components:
- .NET desktop development workload (Includes C#)
- GitHub Extension for Visual Studio (If you want to clone the companion repository.)
You should have a general knowledge of Visual Studio; you will be adding and editing files, and running and debugging code. Familiarity with C#, including interfaces, callbacks, and events, will be helpful.
There is a companion repository for this post available on GitHub. It contains the complete source code for the tutorial project.
Creating the project
Begin this tutorial by creating a WPF App (.NET Core) project for C# named WpfPingMonitor. You can put the solution and project folders wherever it’s most convenient for you.
The data you will be plotting in this project will be the amount of time it takes for your computer to ping google.com, referred to as the ping round trip or latency. This technique is often used in applications to determine if a website is reachable (by specifying a different URL instead of google.com) or if the computer is maintaining internet connectivity.
Add the NuGet package, ScottPlot.WPF, to add the charting capabilities for this project. You can do this by opening the Package Manager Console in Visual Studio and execute the following command-line instruction:
You can, of course, also use the VS 2019 user interface or the .NET CLI.
Note: The author of ScottPlot, Scott Harden, suggests specifying the version number. ScottPlot is under active development and future versions associated may implement different method signatures. Selecting version 4.0 will ensure the application code provided in this tutorial will always work.
Adding the data model
Add a class file and name it PingResult.cs. Replace the entire contents with the following C# code:
This block of code defines a class that will store the data points.
Latencyis the ping’s roundtrip time.Timestampis the time the data point is created.OADateis a double representation of a timestamp. The ScottPlot chart component uses double-precision floating point values to represent dates, the old OLE Automation date format. This is a helper property to speed up operations.Successis a boolean signifying the success or failure of the ping attempt.There are times when thePing.Sendmethod will time-out or fail. This flag will only betrueif that method returns data.
Create a class file named Pinger.cs in the project root. This class is the view-model for the plot’s data. It will also be responsible for periodically pinging google.com and saving the returned data.
Replace the template-generated code in the new file with the following:
The HostNameOrAddress field holds the URL that the application will check. The constant is set to google.com but can be any IPAddress class or URL string you are interested in monitoring.
The PingResults ObservableCollection<T> holds the collection of PingResult objects, one for each ping data point. This type of collection provides binding to the user interface and enables the UI to be updated when the data changes by implementing the INotifyCollectionChanged interface, which exposes the CollectionChanged event.
Inside the Pinger constructor, a DispatchTimer is constructed and initialized. On the event Tick, PingNow() is called to add a new data point to the PingResults collection.
Note that PingNow() also gets called from the constructor to add a data point to the collection. The rationale here is that the method is deferred for the timer’s interval. At the same time, the subsequent call will be invoked immediately, populating the collection with at least one point of data. This is a user experience issue, making the chart show data immediately upon startup instead of waiting for the timer interval to lapse. Users tend to be impatient. 😉
The PingNow() method is the heavy lifter here, pinging the remote website or URL and returning the amount of time it took. There is a possibility that the ping will not return in an appropriate amount of time. In those cases, the method marks the data point as unsuccessful. After the data point is collected, the variables holding the Average, MinPing, MaxPing, DatapointCount, and MissedCount are updated appropriately.
The event handler, PropertyChangedEventHandler, supports the INotifyPropertyChanged interface that the Pinger class implements. This is required by WPF to implement data binding. It is the mechanism that informs the UIElements when changes to data occur.
Implementing the presentation
With the data in place, the user interface for the data can be defined. Open MainWindow.xaml and replace the boilerplate code with the following:
The top-level container implemented is a DockPanel. Within the DockPanel, a StackPanel is nested to the left using the DockPanel.Dock="Left" attribute.
Within the top-level StackPanel, other StackPanels present metric data. Each includes a label and a TextBlock to show read-only data.
The MaxPoints user interface element is an editable TextBox that accepts user input to specify the number of data points to display.
Also within the top-level DockPanel is the WpfPlot element, which is the ScottPlot chart component.
To get the application running, the MainWindow class needs an instance of the Pinger class, and a timer to update the chart. The PlotNow() method will be called every second. Its job is to gather the data and formulate the chart.
Open MainWindow.xaml.cs and replace the existing code with the following:
When the application launches a timer starts and calls PlotNow() every second. PlotNow() generates and updates the plot’s data. The data points to be plotted are extracted from the collection myPinger using a LINQ expression that converts the collection results to an array. If there is no new data, the method simply returns. When new data is ready to be presented, it is placed into arrays for each axis and passed to the plot object. The y-axis is confined to a scale of 0 to 100 to prevent the data from bouncing around if the setting is left at the default: autoscale.
With that in place, the application is ready to compile and run.
Testing the completed application
Before beginning, verify that the URL is pingable from the command line. Open a PowerShell or Windows Command console window and execute the following command-line instruction:
If the ping command responds with a “Request timed out.” message four times in a row, the application won’t be able to present any data. The most likely cause is that your Windows Security firewall settings have not been configured to allow ping requests. To make the required change to the File and Printer Sharing (Echo Request - ICMPv4-In) setting, follow these simple instructions provided by Indiana University. (Go Hoosiers!)
Other factors may impede the ping utility from working, including anti-virus software and internet service provider rules. But start with the firewall before investigating other causes.
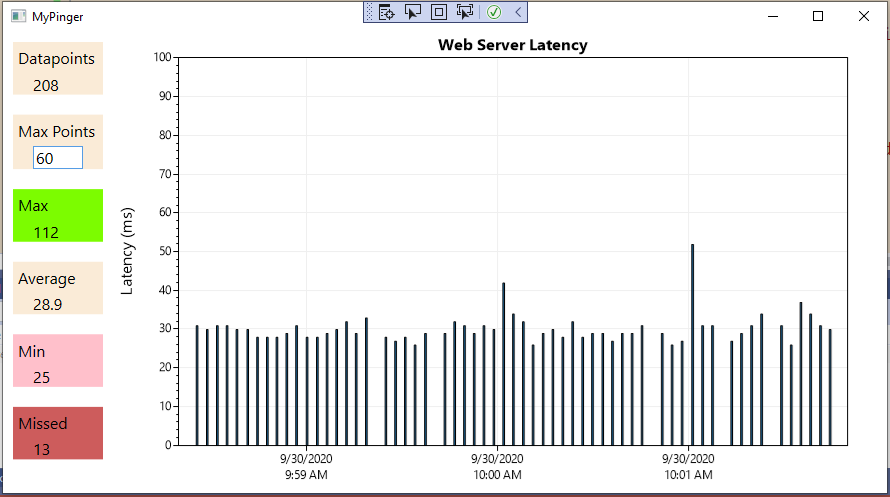
Build and run the application. As soon as the application starts, a data point will present. It represents the speed in milliseconds it took for the signal to hit the URL (google.com) and return. Your values will vary depending on your specific internet configuration. Here is an example of the application running. Changing the value is Max Points will change the maximum number of bars presented in the chart.
The fastest, slowest, and average ping speed and the total number of data points and missed data points will update with each data point.
Potential enhancements
There are many ways to enhance this project. Consider storing the data in a database to retain data. If you want to be notified of the loss of connection to a website or internet, sounding an alarm might make sense; the data collection process could run as a service in the background andhe presentation portion would simply reflect the data in the database. Consider using Twilio Programmable SMS to be notified of a loss of connection.
Summary
In this post you saw how you can easily add real time interactive data charts to WPF applications using WPF data binding and the ScottPlot NuGet package for WPF. You saw how to ping a website and plot the ping response time using ScottPlot, and how to display data about the monitoring process using XAML layout in WPF. You also saw the implementation of the ScottPlot.WPF library, which tackles the idea of charting slightly differently and offers a nice tool to have in your arsenal.
The charting capabilities of WPF can make presentation of data more attractive, comprehensive, and dynamic. Trends and patterns are easy to see in charts. Line charts, bar charts, area charts, and even pie charts are possible. Let your imagination and creativity soar.
Additional resources
The following resources will enable you to explore the technologies discussed in this post:
ScottPlot – A general description of the charting library.
ScottPlot Cookbook – An extensive collection of ways ScottPlot can be coded and implemented.
ScottPlot Demo – A demonstration of the ScottPlot in action.
Using Twilio Lookup in .NET Core WPF Applications – Learn how to verify phone numbers and obtain caller information with the WPF.
TwilioQuest – If you’d like to learn more about programming C# and other languages, try this action-adventure game inspired by the 16-bit golden era of computer gaming.
Jeffrey Rosenthal is a C/C++/C# developer and enjoys the architectural aspects of coding and software development. Jeff is an MCSD and has operated his own company, The Coding Pit, since 2008. When not coding, Jeff enjoys his home projects, rescuing dogs, and flying his drone. Jeff is available for consulting on various technologies and can be reached via email, Twitter, or LinkedIn.
Related Posts
-
 The Ins and Outs of DMARC Monitoring in 2026Denis O'Sullivan
 -
 Detecting iOS 26 Call Screening and Leaving Voicemail: How Twilio AMD and Real-Time Transcriptions Make It PossibleRosina Garcia Bru Robert McCulley
 -
 Model Context Protocol: Real-World Performance Testing of Twilio Alpha's MCP ServerNoah Mogil
Related Resources
Twilio Docs
From APIs to SDKs to sample apps
API reference documentation, SDKs, helper libraries, quickstarts, and tutorials for your language and platform.
Resource Center
The latest ebooks, industry reports, and webinars
Learn from customer engagement experts to improve your own communication.
Ahoy
Twilio's developer community hub
Best practices, code samples, and inspiration to build communications and digital engagement experiences.