Guide
Advanced marketing attribution in your own data warehouse
Twilio Segment + SegmentStream
Time to read:
Segment collects web and app events and sends them to your warehouse. SegmentStream turns them into cross-channel attribution, marginal ROAS, and automated budget allocation: a measurement and optimization layer built for the AI era.
What you'll learn
Marketing teams need to see what's working, what isn't, and where the next dollar of budget earns the most back. That takes a system that measures what customers do, attributes revenue to the channels that caused it, and turns the result into a decision about where to spend next.
This system runs on three kinds of data.
Behavior. Every session, page view, and purchase on web and app.
Cost. Daily spend and clicks per campaign, spread across every ad account you run.
Outcome. What the customer was worth in the end. Closed deals, renewals, refunds, margin.
Segment covers the first. It gets behavior out of your website and app with consistent event names and a working identity signal and writes it to BigQuery,Snowflake, and all other major data warehouse platforms.
SegmentStream covers the rest:
Ad platform and CRM data ingestion — built specifically for attribution and full-funnel measurement
Advanced attribution modeling — including first-touch, multi-touch, and custom models
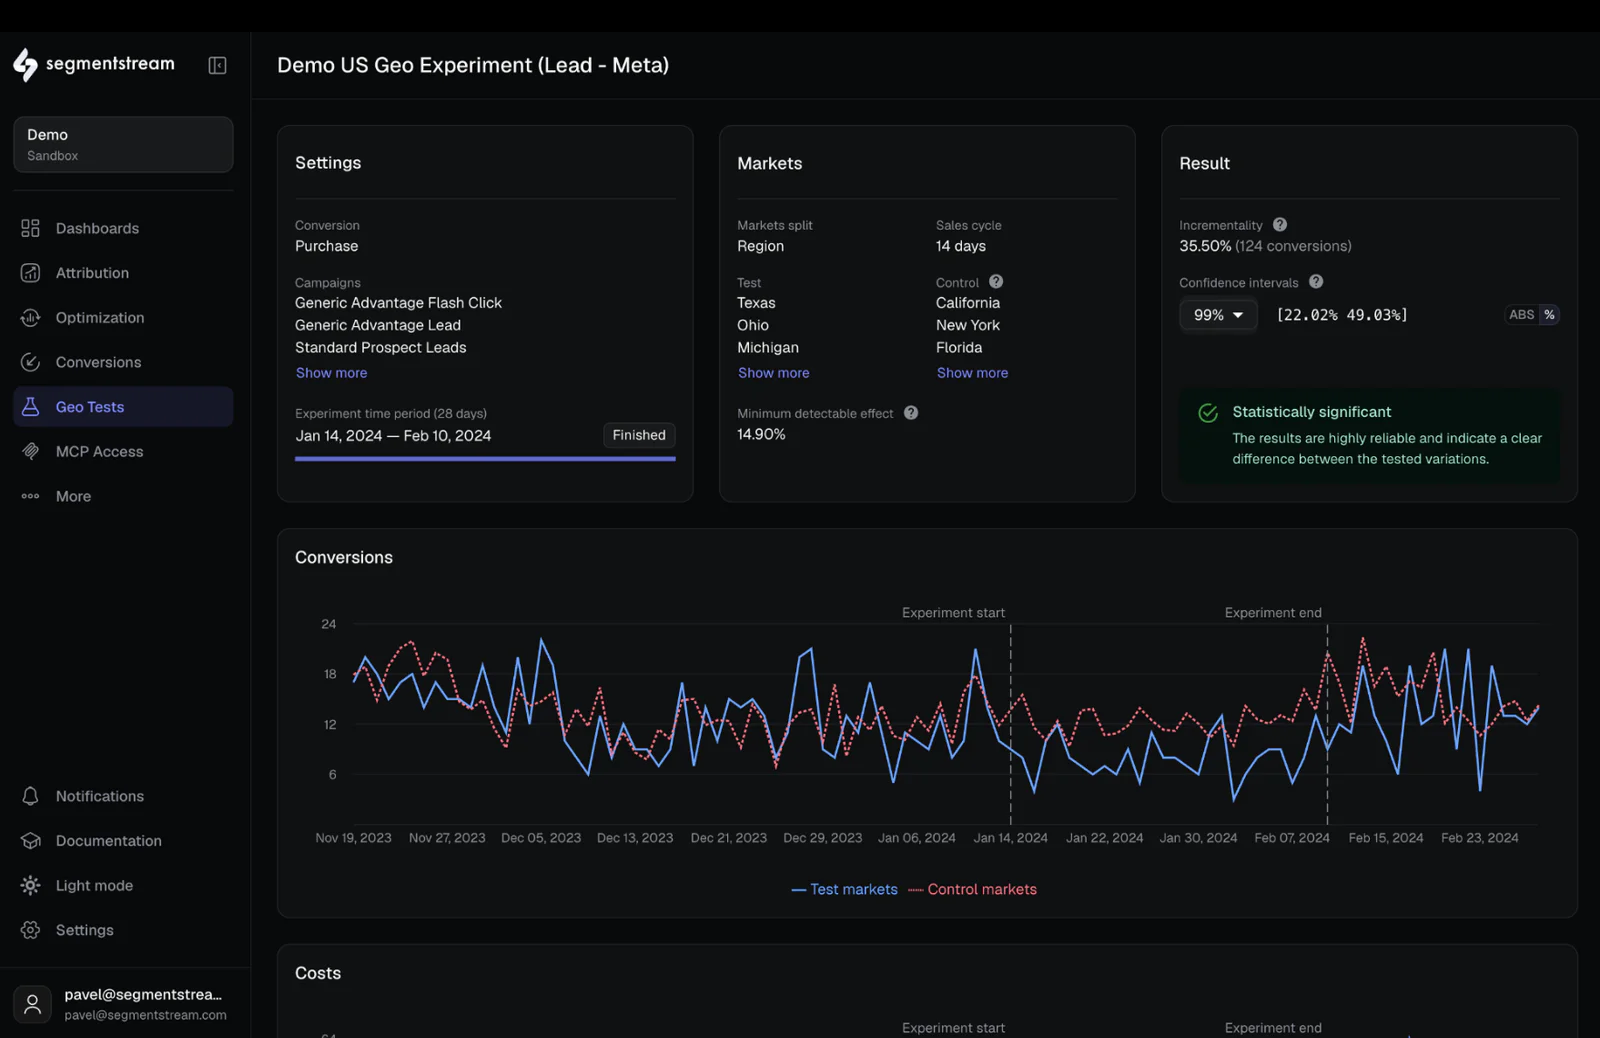
Incrementality and marginal ROAS/CPA insights
Scenario planning and budget recommendations
Automated budget allocation across platforms
Custom reporting and visualization, plus an open MCP layer any AI agent can read and act on
Combine the two and a marketing team has enterprise-grade measurement infrastructure that is composable: every layer runs on a warehouse you own, every result is a plain table you can inspect, and any BI tool or AI agent can read it.
What the two make possible
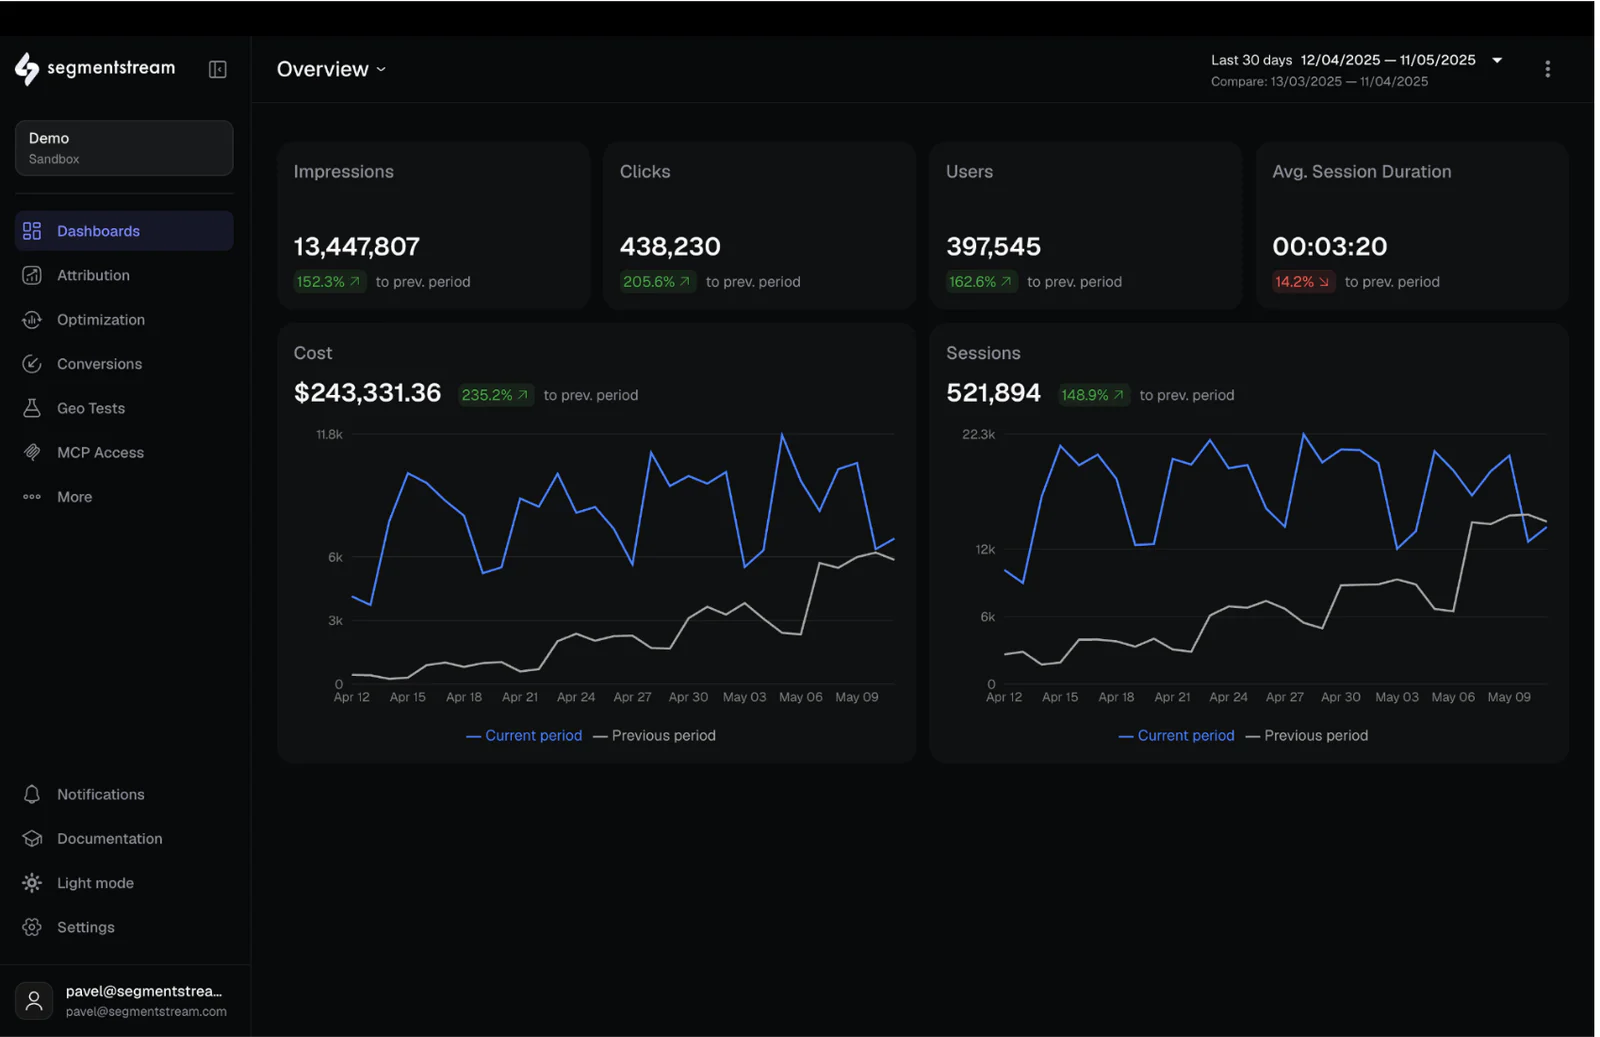
Once SegmentStream is reading your Segment tables, here is what you can do with them.
- See which channel started the purchase, not which one closed it. Your identify calls let SegmentStream link a customer's phone, laptop, and in-app sessions into one journey. What last-click books as a single brand-search conversion turns back into an Instagram ad in week one, an organic visit in week two, and a branded search at the end.
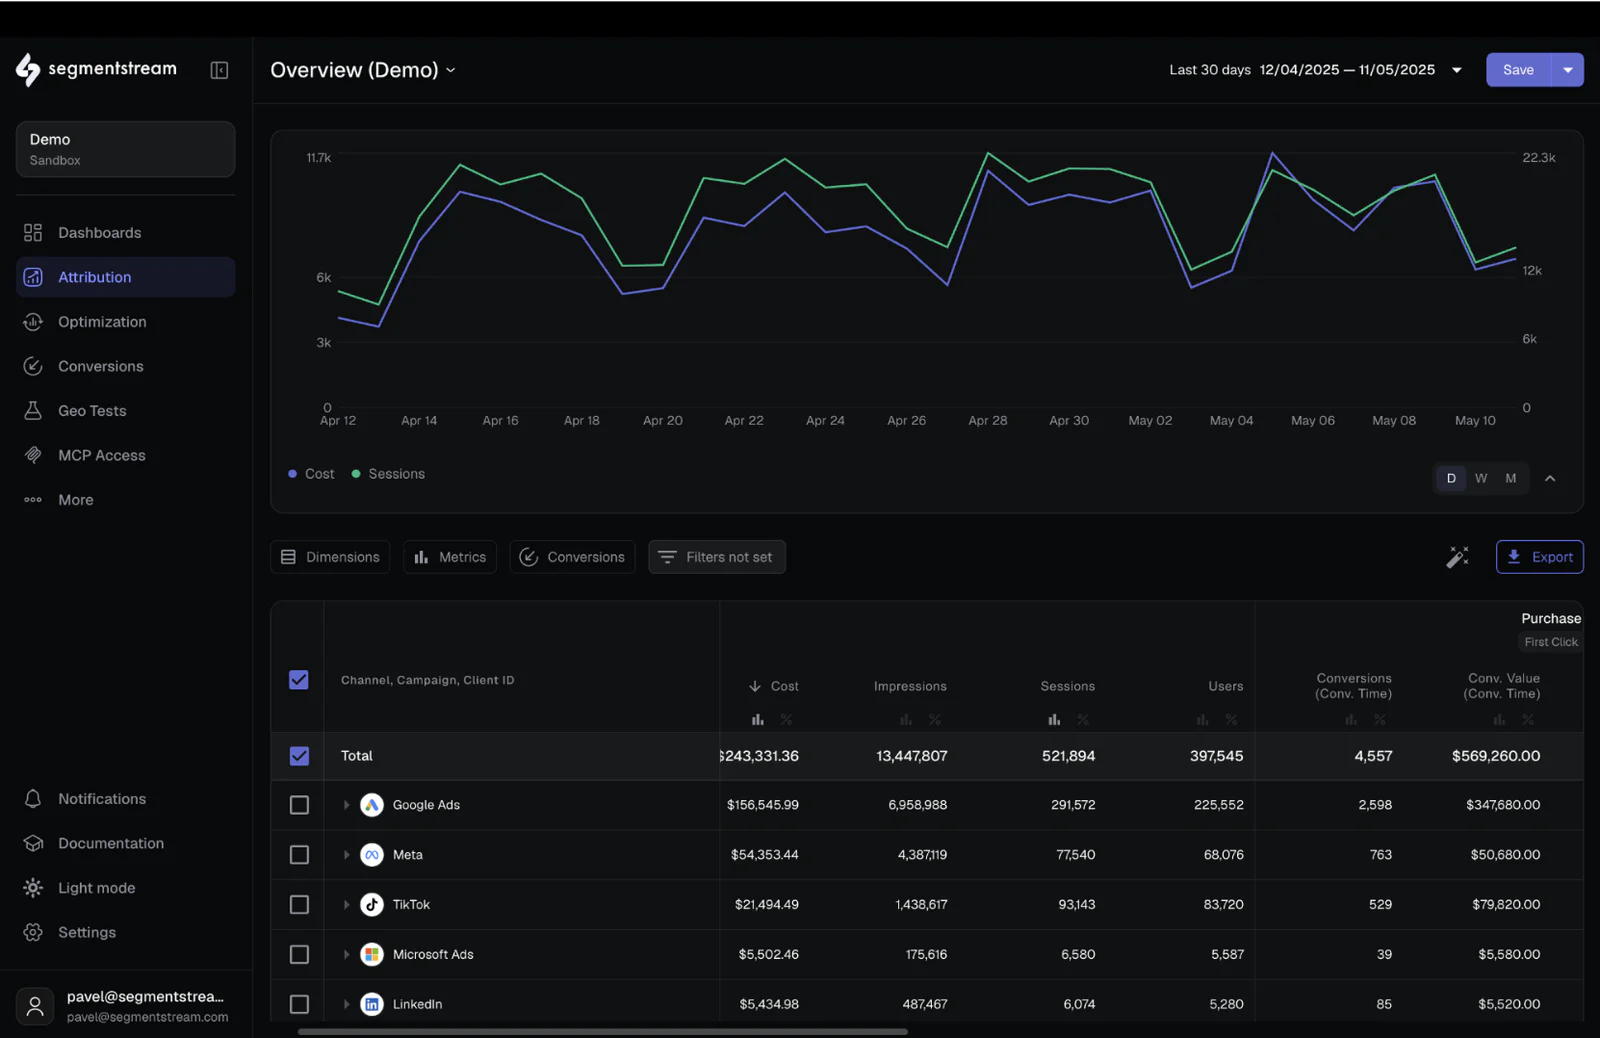
- Attribute closed revenue instead of form fills. Segment records the signup, your CRM knows whether it became a deal. MQL, SQL, Opportunity, and Closed/Won each get attributed separately, so you see which channels bring leads and which bring revenue. For most B2B teams those are different lists.
- Optimize on margin rather than revenue. Attribute against the margin, refund, and return tables already in your warehouse, and campaigns pushing high-revenue, low-margin products stop looking like winners.
- Measure channels that produce no click. Send "How did you hear about us?" answers through Segment as a trait. SegmentStream sorts the free text into channels and stitches it back to sessions, putting podcasts, TV, and word of mouth on the same chart as paid search.
- Know where the next dollar goes. A diminishing-returns curve per campaign gives you marginal ROAS rather than average, so budget moves out of saturated campaigns into ones still climbing.
- Send the results back into Engage. Predicted LTV, lead score, and true acquisition channel return to Segment as traits through Reverse ETL. Seed lookalikes from high-LTV customers, suppress low-scoring leads from retargeting, branch journeys on the channel that actually acquired someone.
Step 1: Add a Warehouse destination in Segment
Start sending web and mobile tracked events by Segment into your data warehouse — such as BigQuery, Snowflake or Databricks. From Segment's Destinations catalog, add the warehouse as a destination on each source you want synced.
Step 2: Connect SegmentStream to the same warehouse
Copy the service account from Settings → Data warehouse and grant it BigQuery Data Viewer and Job User, or the equivalent read role on Snowflake or Redshift. Map anonymous_id and user_id. The first run reprocesses your full history, so attribution goes back to the day the destination was enabled.
Step 3: Connect ad platforms, CRM, and business data
Ad platforms over OAuth from Data sources: Google Ads, Meta, LinkedIn, TikTok, DV360, The Trade Desk and 30+ more, each pulling daily cost at campaign, ad set, and ad level. From your CRM, pull stage history rather than current stage, because attributing a Closed/Won needs the date the record entered each stage. Then your margin, refund, and renewal tables.
Step 4: Define what counts as a conversion
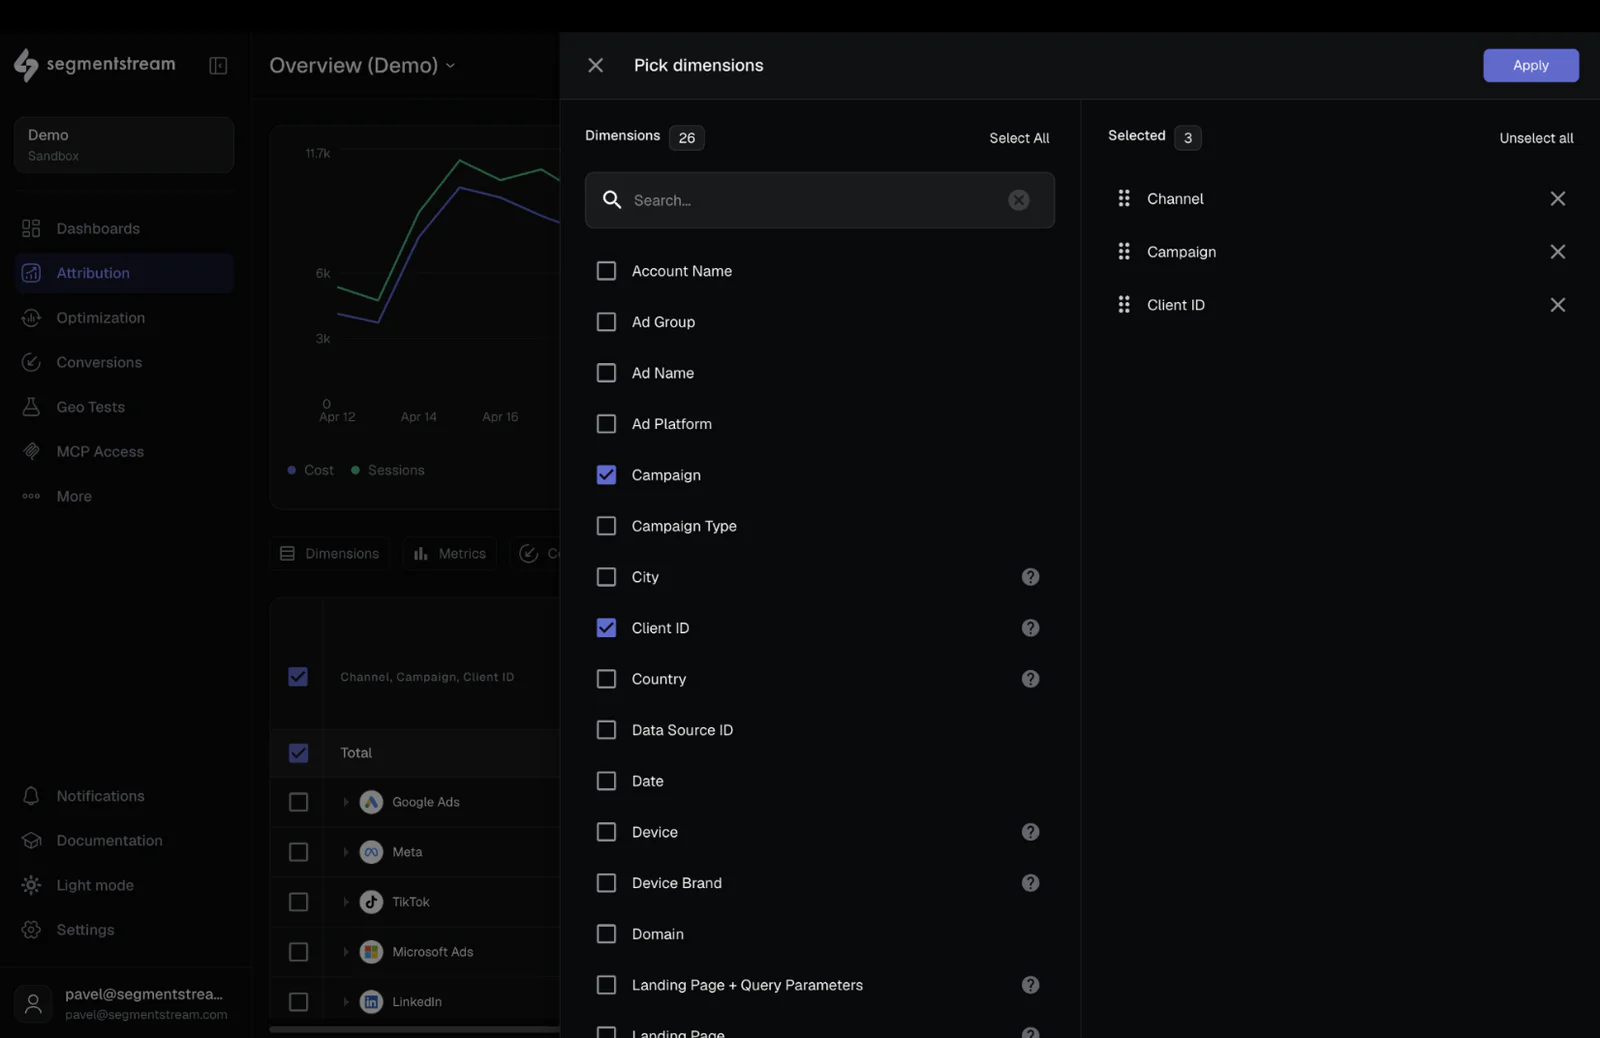
Segment events like Order Completed; CRM stages from MQL to Closed/Won, each attributed separately; any warehouse table with a timestamp and a joinable ID. Point a negative conversion at refunds, and use margin or contract value rather than gross revenue.
What runs after that
You review the output, not the process.
Identity resolution. user_ids, email matches, and CRM records link anonymous_ids into one person, using deterministic links only. If you run Segment Unify, Profiles Sync gives SegmentStream Segment's own resolved identity as a starting point — improving customer journey stitching for more accurate upper-funnel attribution.
Attribution. First-click on resolved journeys, multi-touch, and CRM funnel attribution, reported at click time so a purchase counts against the week the ad ran. A predictive model projects the conversions that haven't arrived yet, so recent weeks stop looking broken.
Self-reported credit. Free-text survey answers get sorted into channels and stitched back to sessions, which is the only way podcasts, TV, and word of mouth appear on the same chart as paid search.
Marginal ROAS. Average ROAS blends good spend and wasted spend into one number. Every campaign gets a response curve instead, and a verdict: room to grow, sweet spot, or saturated.
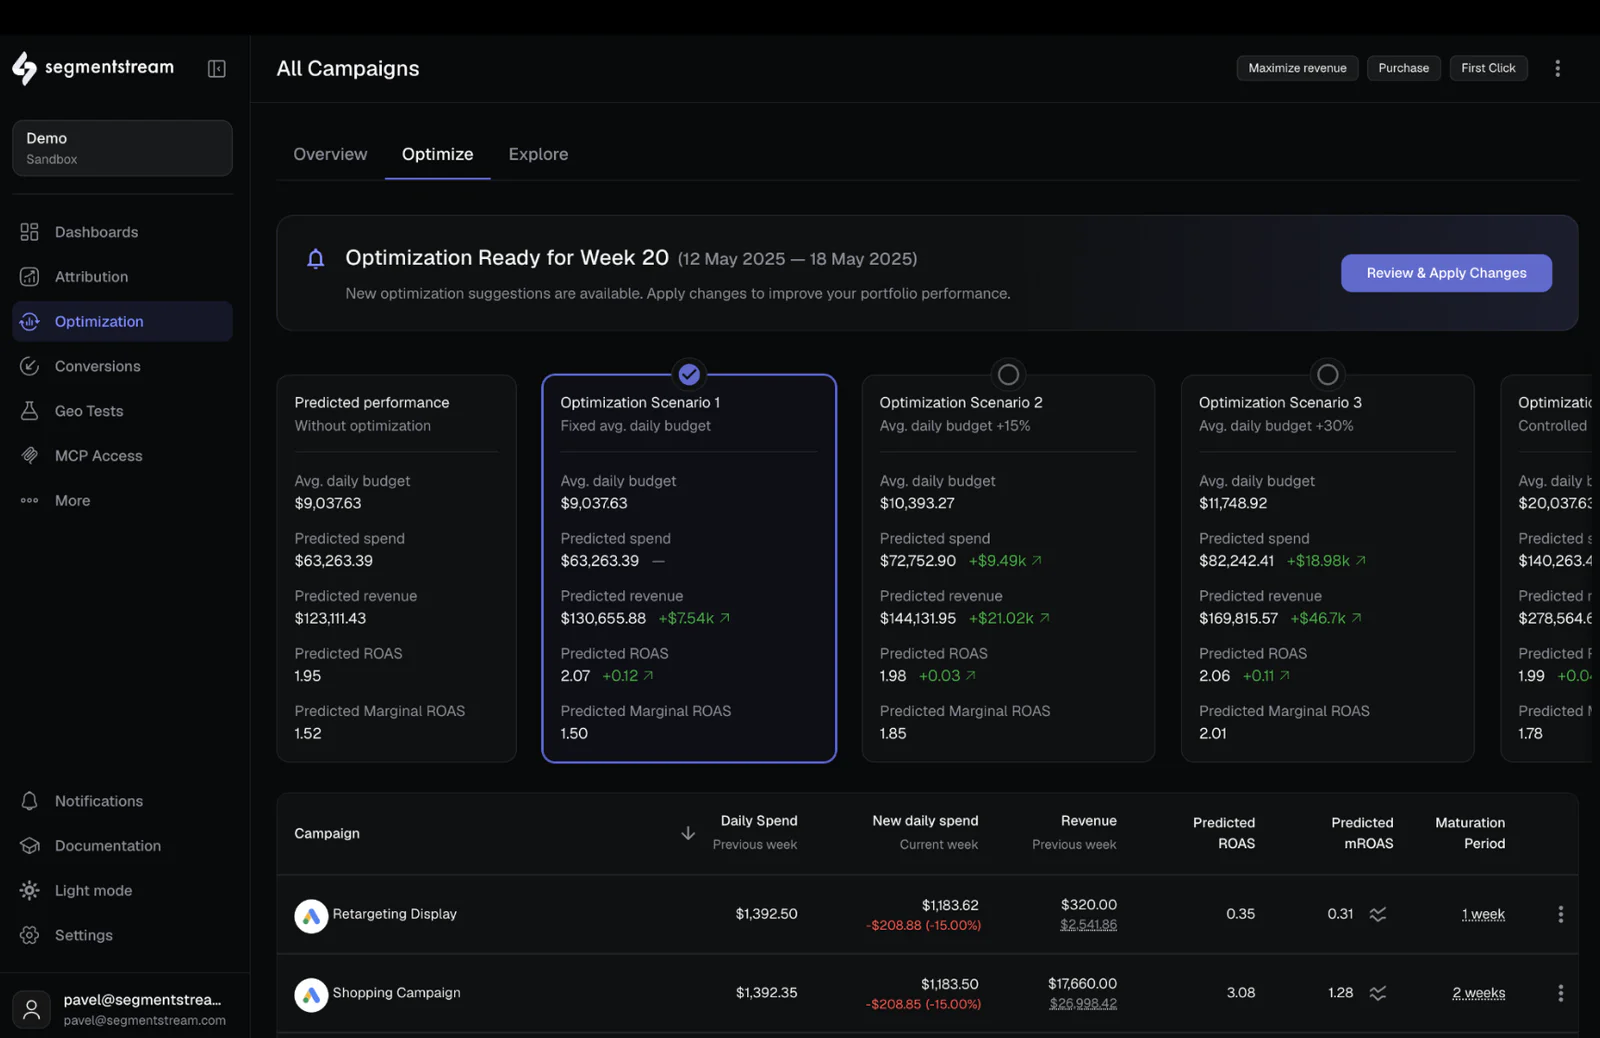
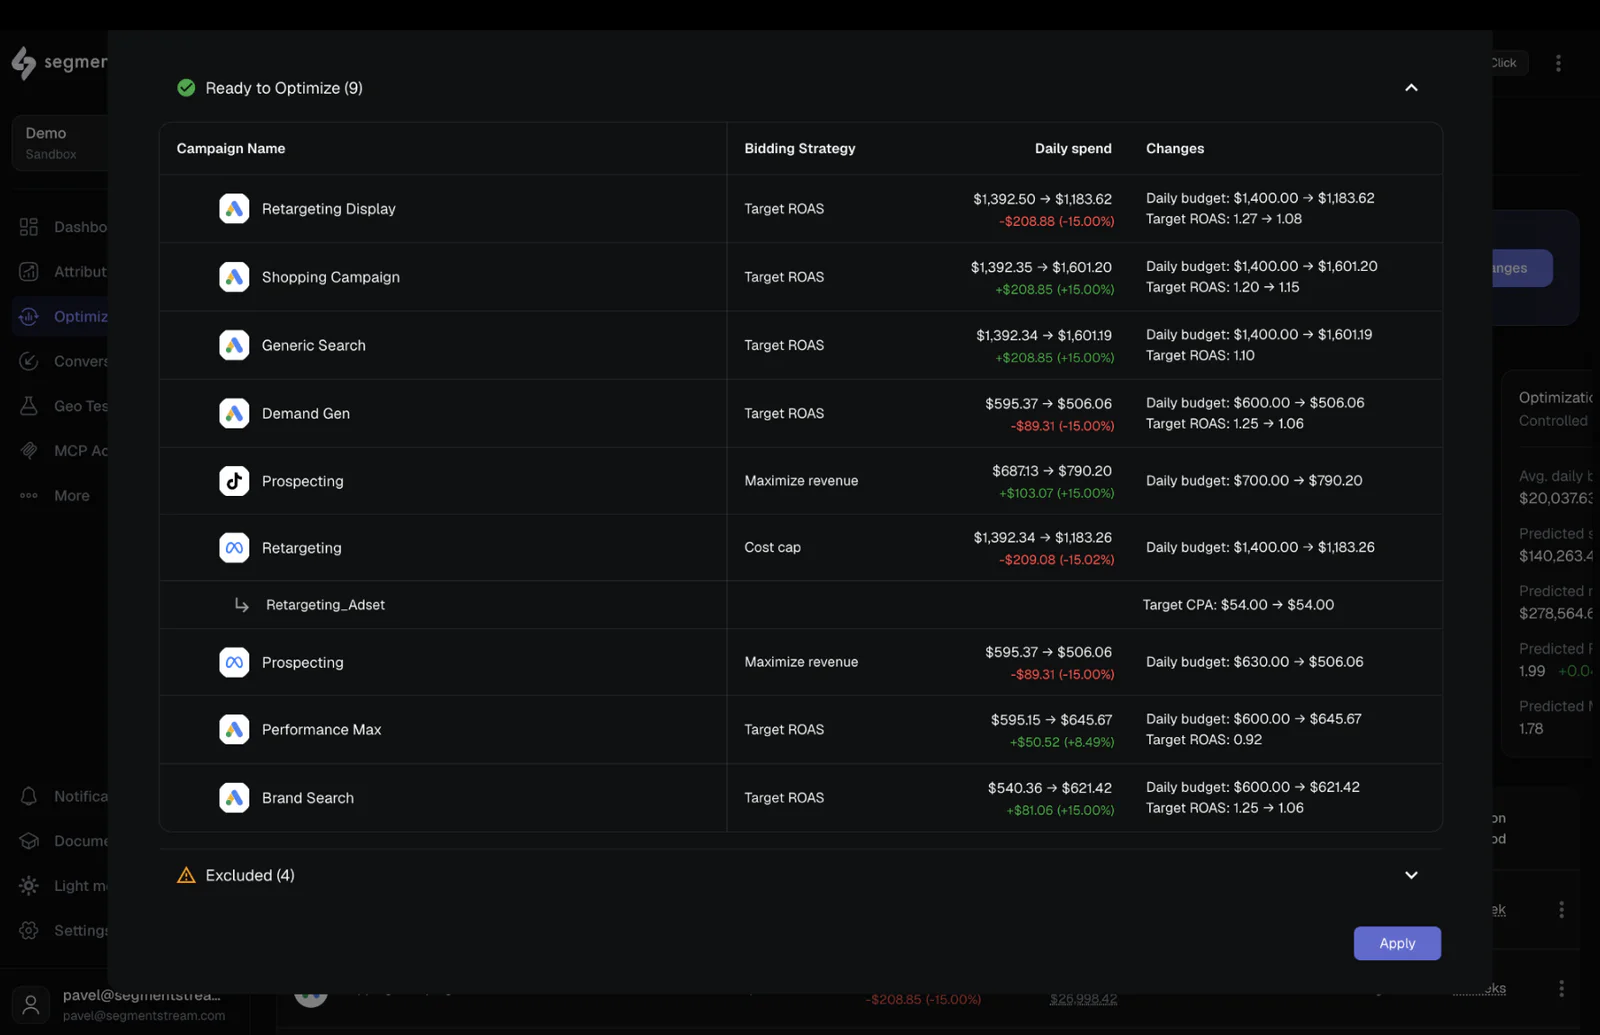
Budget recommendations. Budget is optimal when marginal ROAS is equal across channels. You get specific amounts per campaign, ready to push to the platforms in one action or export for review. Each weekly cycle compares what was predicted against what happened.
Trusted conversions back to the ad platforms. Only qualifying conversions get forwarded server-side through Meta CAPI, Google Enhanced Conversions, and the TikTok Events API, so the bidding algorithms optimize against real outcomes rather than raw form fills.
Results back into Segment. Acquisition channel, predicted LTV, lead score, and churn risk are written to your warehouse, where Reverse ETL attaches them to profiles as custom traits for Engage audiences.
Wrapping up
Here's what we've done in this recipe:
One identity per customer instead of one per device
Attribution across every stage you care about, from first touch to closed revenue, net of refunds
Credit for offline and word-of-mouth channels
Results you can split by margin, product, region, or customer tier
Scores written back into Segment as traits for Engage